Your Best Keywords Are Already in Your Data
You're sitting on a goldmine of keyword opportunities and probably don't even know it.
Google Search Console (GSC) contains something no third-party tool can replicate: the actual search queries that brought real users to your website. Not estimates. Not projections. Real data from Google itself showing exactly what people typed before clicking on your pages.
Yet most website owners check GSC once, glance at a few metrics, and never dig deeper. They miss the quick-win keywords hiding on page two, the content gaps begging to be filled, and the rising queries that could drive next month's traffic surge.
In this guide, you'll learn how to systematically mine your Google Search Console data to discover keyword opportunities that improve your rankings without creating new content from scratch. We'll cover finding low-hanging fruit keywords, identifying content gaps, improving existing pages, and tracking your progress over time.
If you have an active website with some organic traffic, GSC might be the most valuable (and completely free) keyword research tool you're not fully using.
Why Google Search Console Is a Keyword Goldmine
Most SEO professionals jump straight to third-party keyword tools when planning content. They enter seed keywords, analyze competitors, and build lists based on estimated search volumes.
That approach works. But it misses something crucial: first-party data about what's already working for your site.
The Value of First-Party Data
Google Search Console shows you queries that actual users typed into Google before finding your website. This data is:
- 100% accurate: These aren't estimates based on clickstream data or extrapolations. Google is telling you exactly what searches led to impressions and clicks.
- Specific to your site: You see which queries YOUR pages appeared for, not generic industry data.
- Free and accessible: If you've verified your site in GSC (and you should have), this data is waiting for you right now.
- Intent-validated: If someone clicked through to your page, the content at least partially matched their intent. You know these keywords convert to visitors.
What Third-Party Tools Can't Tell You
Even the best keyword research tools have limitations when compared to your own GSC data:
| GSC Data | Third-Party Tools |
|---|---|
| Actual queries triggering YOUR pages | Estimated queries based on industry data |
| Your real click-through rates | Average CTR estimates |
| Exact position for each query | Estimated ranking difficulty |
| Queries you rank for unintentionally | Only queries you actively research |
| Your actual impressions vs. clicks | Projected traffic potential |
The most valuable insight from GSC? Discovering what you rank for that you never intentionally targeted. These accidental rankings often represent your biggest opportunities.
How GSC Complements Other Keyword Research
Think of GSC as your "what's working now" tool and third-party research as your "what could work" tool. The best keyword strategies combine both:
- Use GSC to find quick wins (existing rankings that need a small push)
- Use GSC to discover topics your audience cares about (based on real queries)
- Use keyword tools to expand on promising GSC discoveries with volume and difficulty data
- Use keyword tools to find entirely new topics you haven't covered yet
When you combine GSC insights with a tool like BrightKeyword, you can take queries you're already ranking for and discover related keywords, synonyms, and question variations to strengthen that content further.
Accessing the Right Reports in GSC
Before we dive into keyword mining strategies, let's make sure you know where to find the data. Google Search Console's interface can be confusing, but for keyword research, you only need one main report.
Navigating to the Performance Report
- Log in to Google Search Console
- Select your property (website) from the dropdown
- Click "Performance" in the left sidebar
- By default, you'll see the "Search results" view (this is what we want)
Switching to the Queries View
The Performance report has several tabs at the top: Queries, Pages, Countries, Devices, Search Appearance, and Dates.
For keyword research, start with the Queries tab. This shows every search query that triggered an impression for your site.
Pro Tip: Make sure all four metrics are enabled at the top of the report:
- Total clicks: How many times users clicked through to your site
- Total impressions: How many times your pages appeared in search results
- Average CTR: Click-through rate (clicks ÷ impressions)
- Average position: Your average ranking position for that query
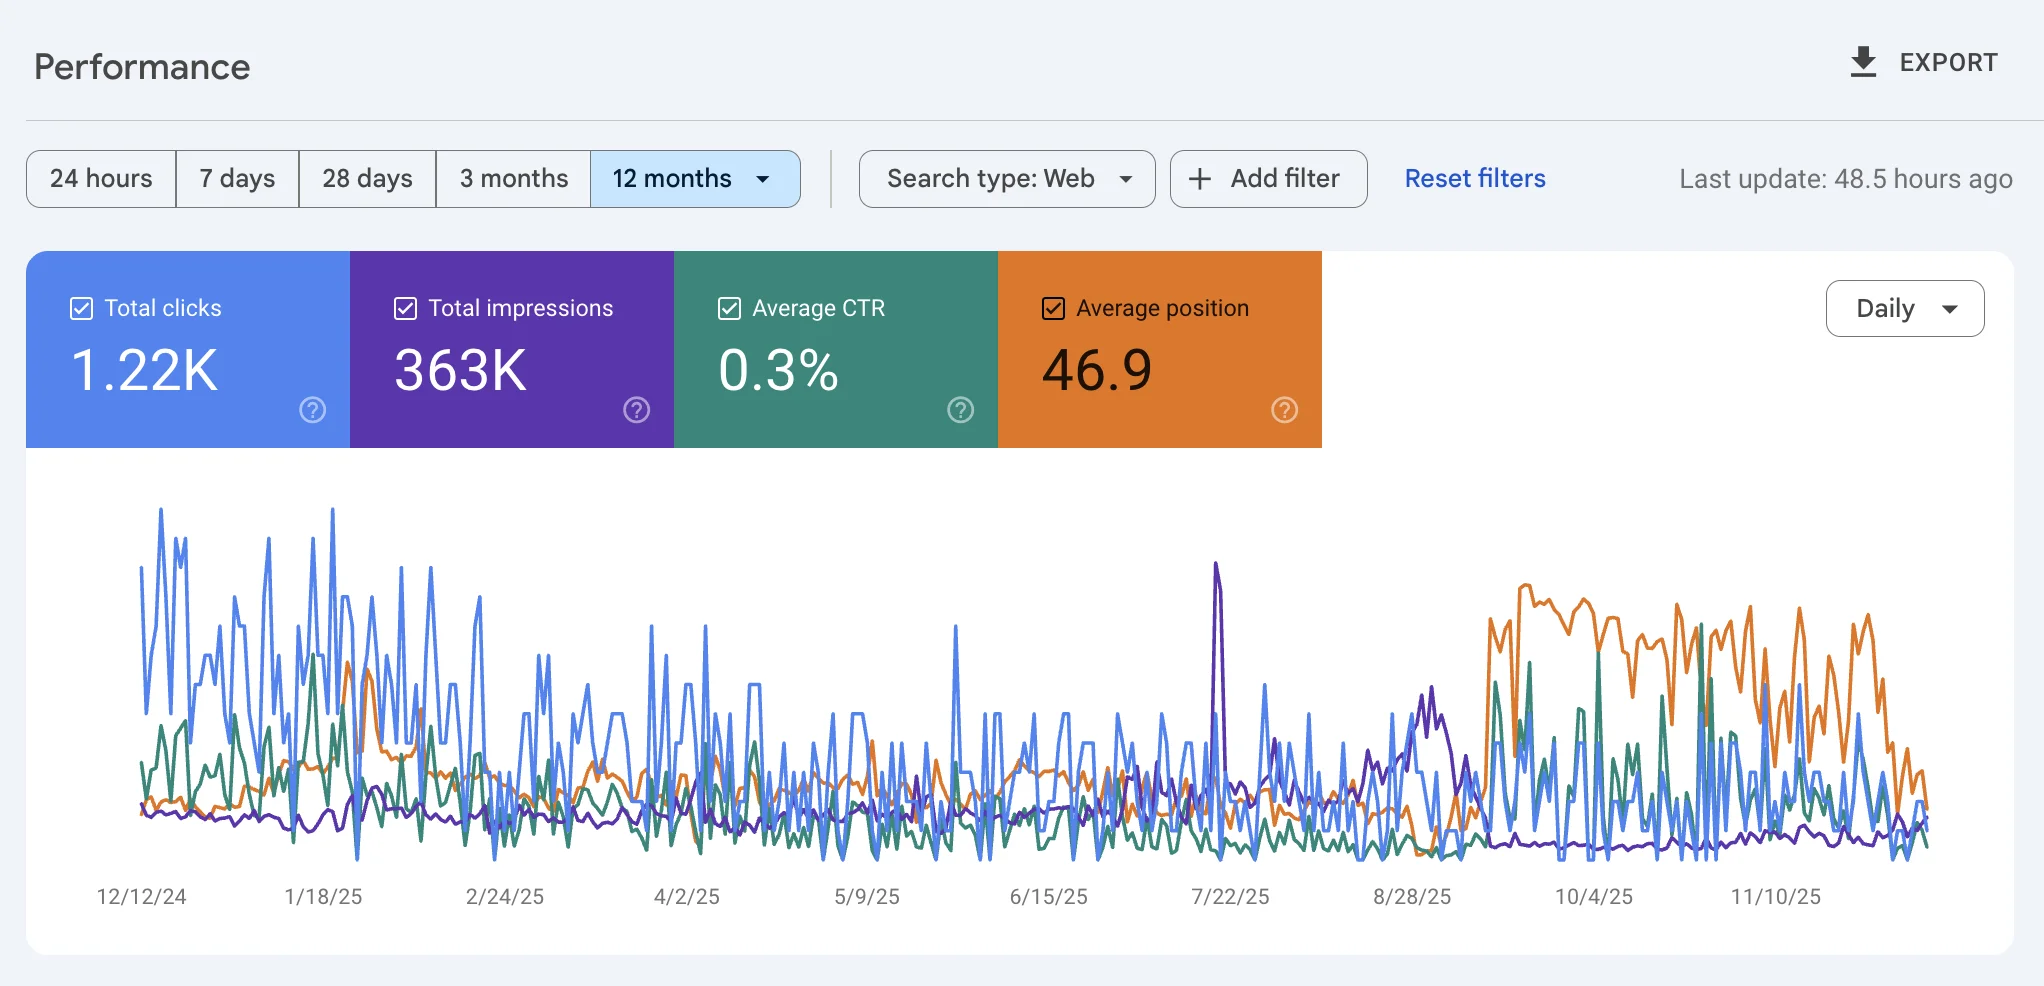
Setting the Right Date Range
The date range you choose significantly impacts your analysis:
- Last 28 days: Good for current performance snapshot
- Last 3 months: Better for identifying patterns and reducing noise
- Last 6 months: Ideal for spotting trends and seasonal variations
- Last 12-16 months: Best for year-over-year comparisons (GSC stores up to 16 months of data)
For most keyword research tasks, 3 months provides enough data to be meaningful while staying current. Use 6-12 months when analyzing seasonal patterns or comparing performance over time.
Exporting Your Data
For deeper analysis, export your GSC data to a spreadsheet:
- Scroll down to the data table
- Click the Export button (top right of the table)
- Choose your format: Google Sheets, Excel, or CSV
Important: GSC limits the interface to displaying 1,000 rows at a time. If your site has more queries than that, the export will include all available data (up to the limits of your date range). For comprehensive analysis, always export rather than relying on the in-interface view. For even larger datasets or automated workflows, see our guide on Python SEO automation which covers pulling GSC data programmatically via the API.
Finding Low-Hanging-Fruit Keywords
Low-hanging fruit keywords are queries where you're almost ranking well but not quite getting clicks. These represent your biggest quick-win opportunities because you're already doing something right. A small optimization can often push these rankings onto page one or into click-worthy positions.
The High Impressions, Low Clicks Pattern
The clearest signal for low-hanging fruit: queries with lots of impressions but few clicks.
High impressions mean Google is showing your page for this query frequently. Low clicks mean users aren't choosing your result, typically because:
- You're ranking on page 2 (positions 11-20)
- You're at the bottom of page 1 (positions 8-10)
- Your title or meta description isn't compelling (see our guide on fixing high impressions with low clicks)
- A featured snippet or other SERP feature is stealing clicks (learn more about adapting to zero-click search)
Here's how to find these opportunities in GSC:
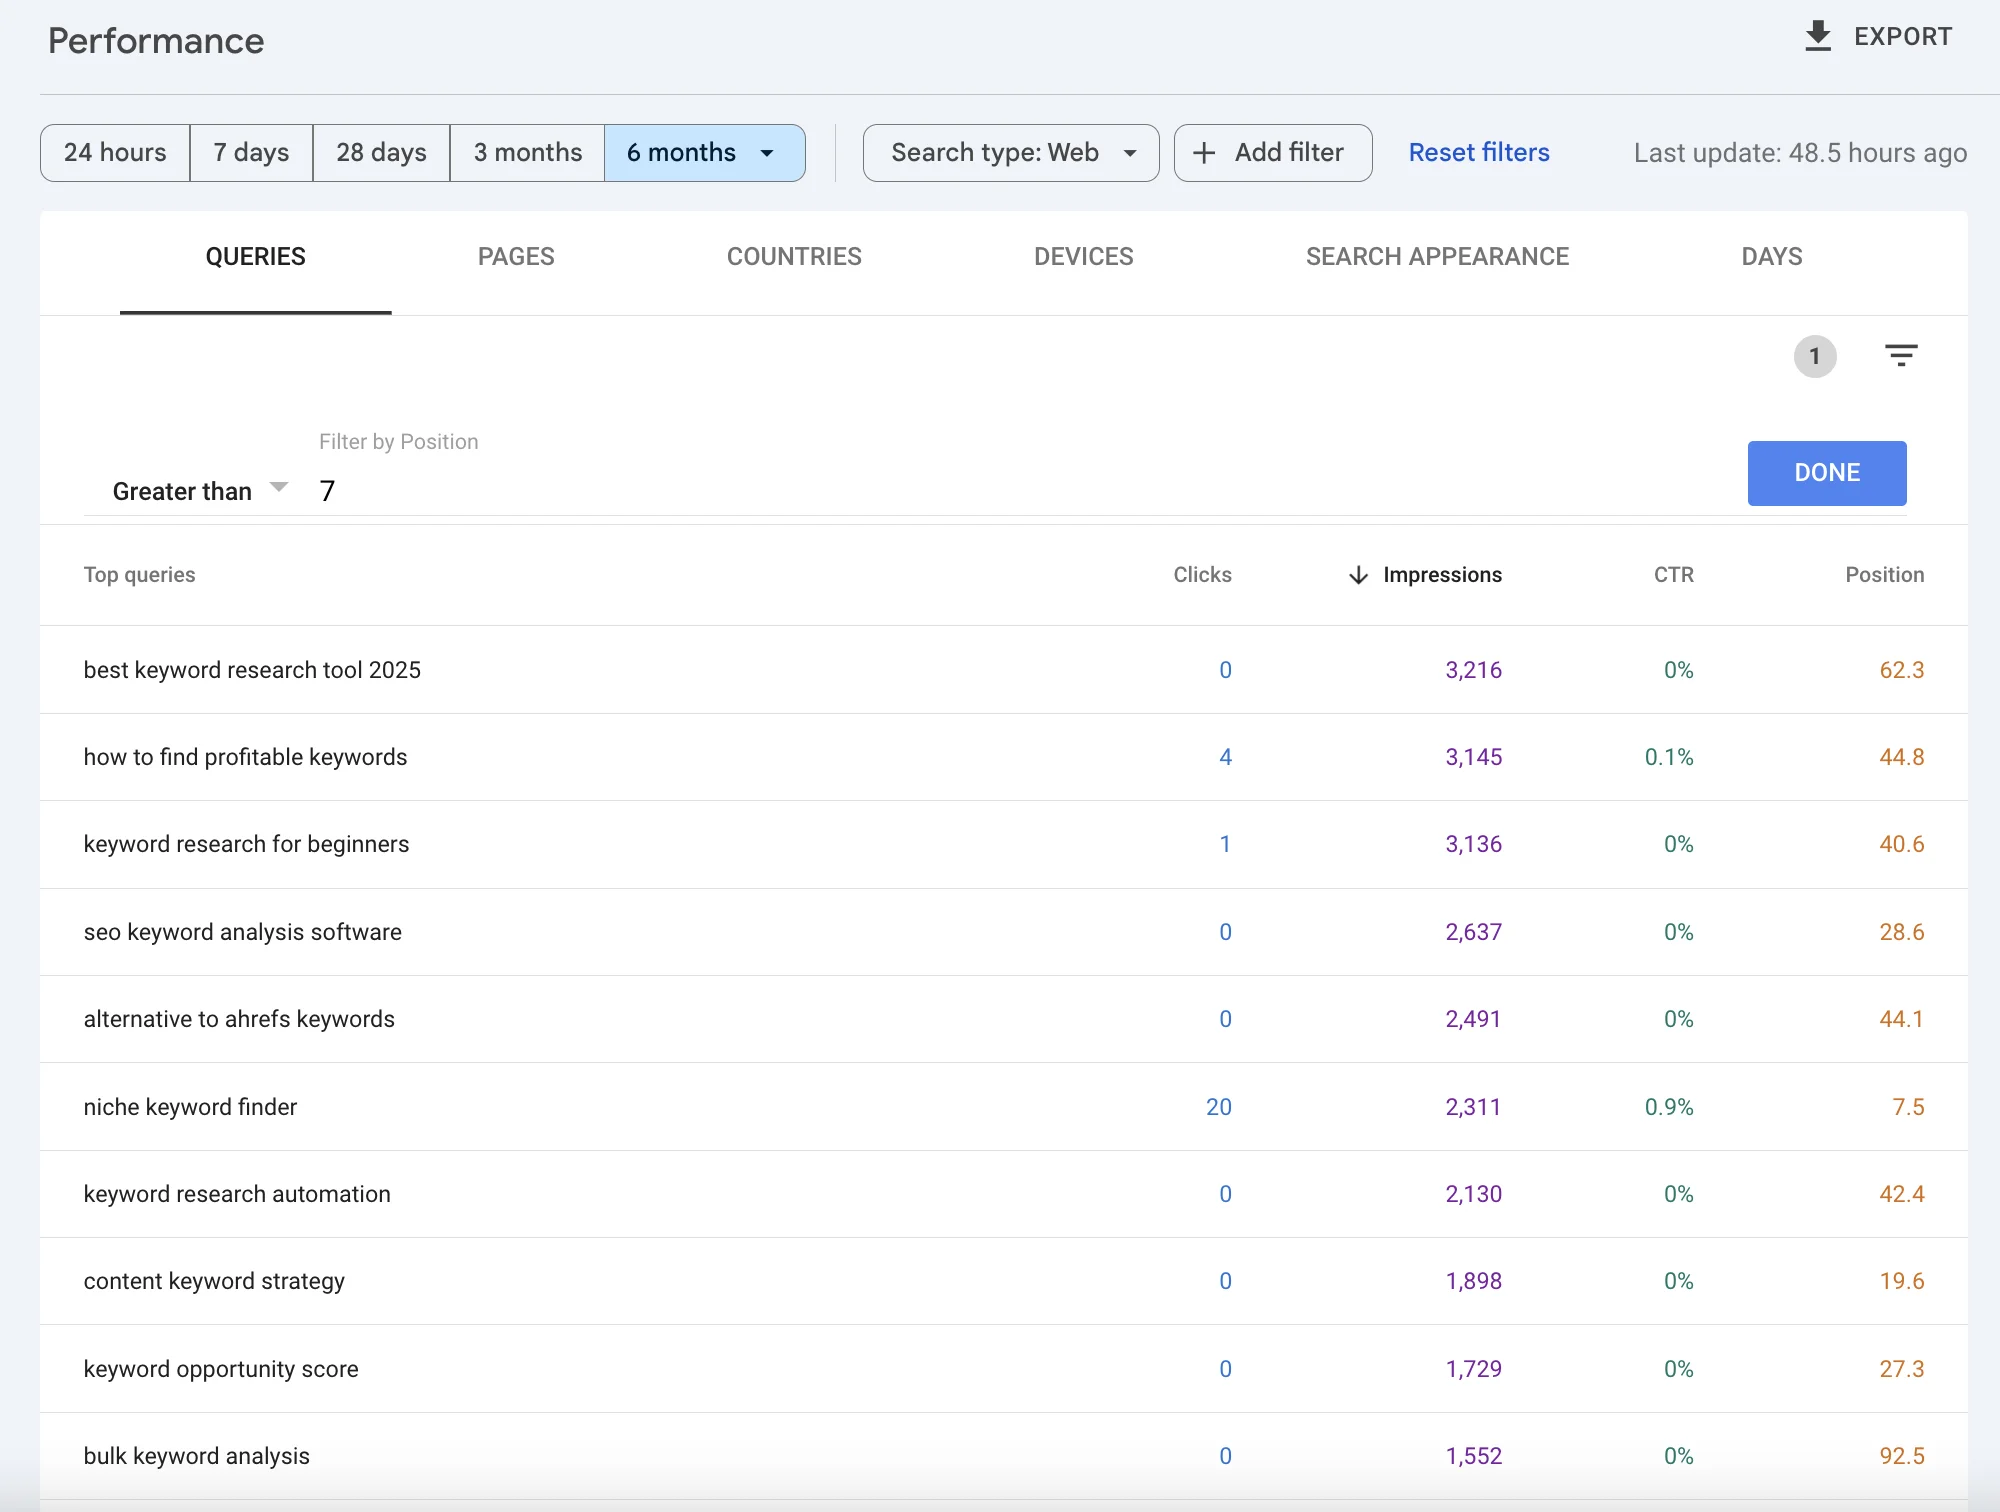
Step-by-Step: Finding Position 8-20 Keywords
- Open the Performance report with all four metrics enabled
- Click the "+New" button to add a filter
- Select "Position" as your filter type
- Set the condition to "Greater than 7" (this shows positions 8 and beyond)
Now you're looking at queries where you rank just outside the top results. Sort this filtered list by Impressions (highest first) to find the keywords with the most visibility potential.
Evaluating Low-Hanging Fruit Opportunities
Not every query in this filtered list is worth pursuing. Evaluate each opportunity by asking:
1. Is this query relevant to my business?
Sometimes you'll rank for queries that don't match your core offerings. A software company might rank for a tangentially related industry term. Unless you want to expand into that topic, skip it.
2. Does the page match the search intent?
Search the query yourself. Look at what's ranking in positions 1-5. Does the content type match yours? If they're all product pages and you have a blog post, you might need a different page to compete.
3. Is the keyword worth the effort?
A query with 10,000 impressions and position 12 is a bigger opportunity than one with 50 impressions and position 9. Prioritize based on potential traffic impact.
Taking Action: How to Improve Rankings for These Keywords
Once you've identified your best low-hanging fruit keywords, here's how to push them higher:
For queries ranking 11-20 (page 2):
Check if the keyword appears in your content: Sometimes you rank for a term without ever using it. Adding it naturally to your H2 headings, introduction, or body text signals stronger relevance.
Expand the content: Your page might be ranking but not fully addressing the topic. Add sections that cover subtopics the top-ranking pages include.
Improve internal linking: Link to this page from other relevant content on your site using the target keyword as anchor text.
Update the publish date: If your content is more than a year old, update it with fresh information and republish. Google notices freshness.
For queries ranking 8-10 (bottom of page 1):
Optimize your title tag: A more compelling title can increase CTR, which may boost rankings. Include the keyword and a benefit.
Improve your meta description: Write a description that addresses the searcher's intent and includes a call to action.
Add structured data: FAQ schema, how-to schema, or review schema can help you win SERP features that capture more attention.
Build a few quality backlinks: Even 2-3 relevant links to this page can provide the authority boost needed to move up.
Real Example: The "Almost Page 1" Opportunity
Imagine your GSC shows this query:
| Query | Clicks | Impressions | CTR | Position |
|---|---|---|---|---|
| how to write a meta description | 12 | 4,500 | 0.3% | 11.2 |
This is a textbook low-hanging fruit opportunity:
- High impressions (4,500): People are searching for this
- Position 11.2: You're at the top of page 2
- Low CTR (0.3%): Very few people click on page 2 results
If you can move this to position 7 or 8, your clicks could jump from 12 to 200+ per month. That's 15x more traffic from a single optimization.
Identifying Content Gaps and New Topic Ideas
Beyond improving existing rankings, GSC reveals topics you should be covering but haven't fully addressed. These content gaps represent new pages waiting to be created.
Discovering Unintentional Rankings
One of the most valuable GSC insights: queries you rank for without trying.
Your "About Us" page might rank for an industry definition. Your case study might rank for a specific tool comparison. These accidental rankings tell you what your audience is looking for that you haven't deliberately created content around.
To find these:
- In the Performance report, click on the "Pages" tab
- Click on a specific page to filter queries for that page
- Review the queries that page ranks for
- Look for queries that don't match the page's primary topic
When you find queries that deserve their own dedicated content, you've found a content gap.
Finding Questions Your Audience Is Asking
Question queries (starting with how, what, why, when, where) often reveal informational needs you can address with new content.
Filter for question queries:
- Add a filter: Queries containing "how to"
- Review the results, then repeat for "what is", "why does", "can I", etc.
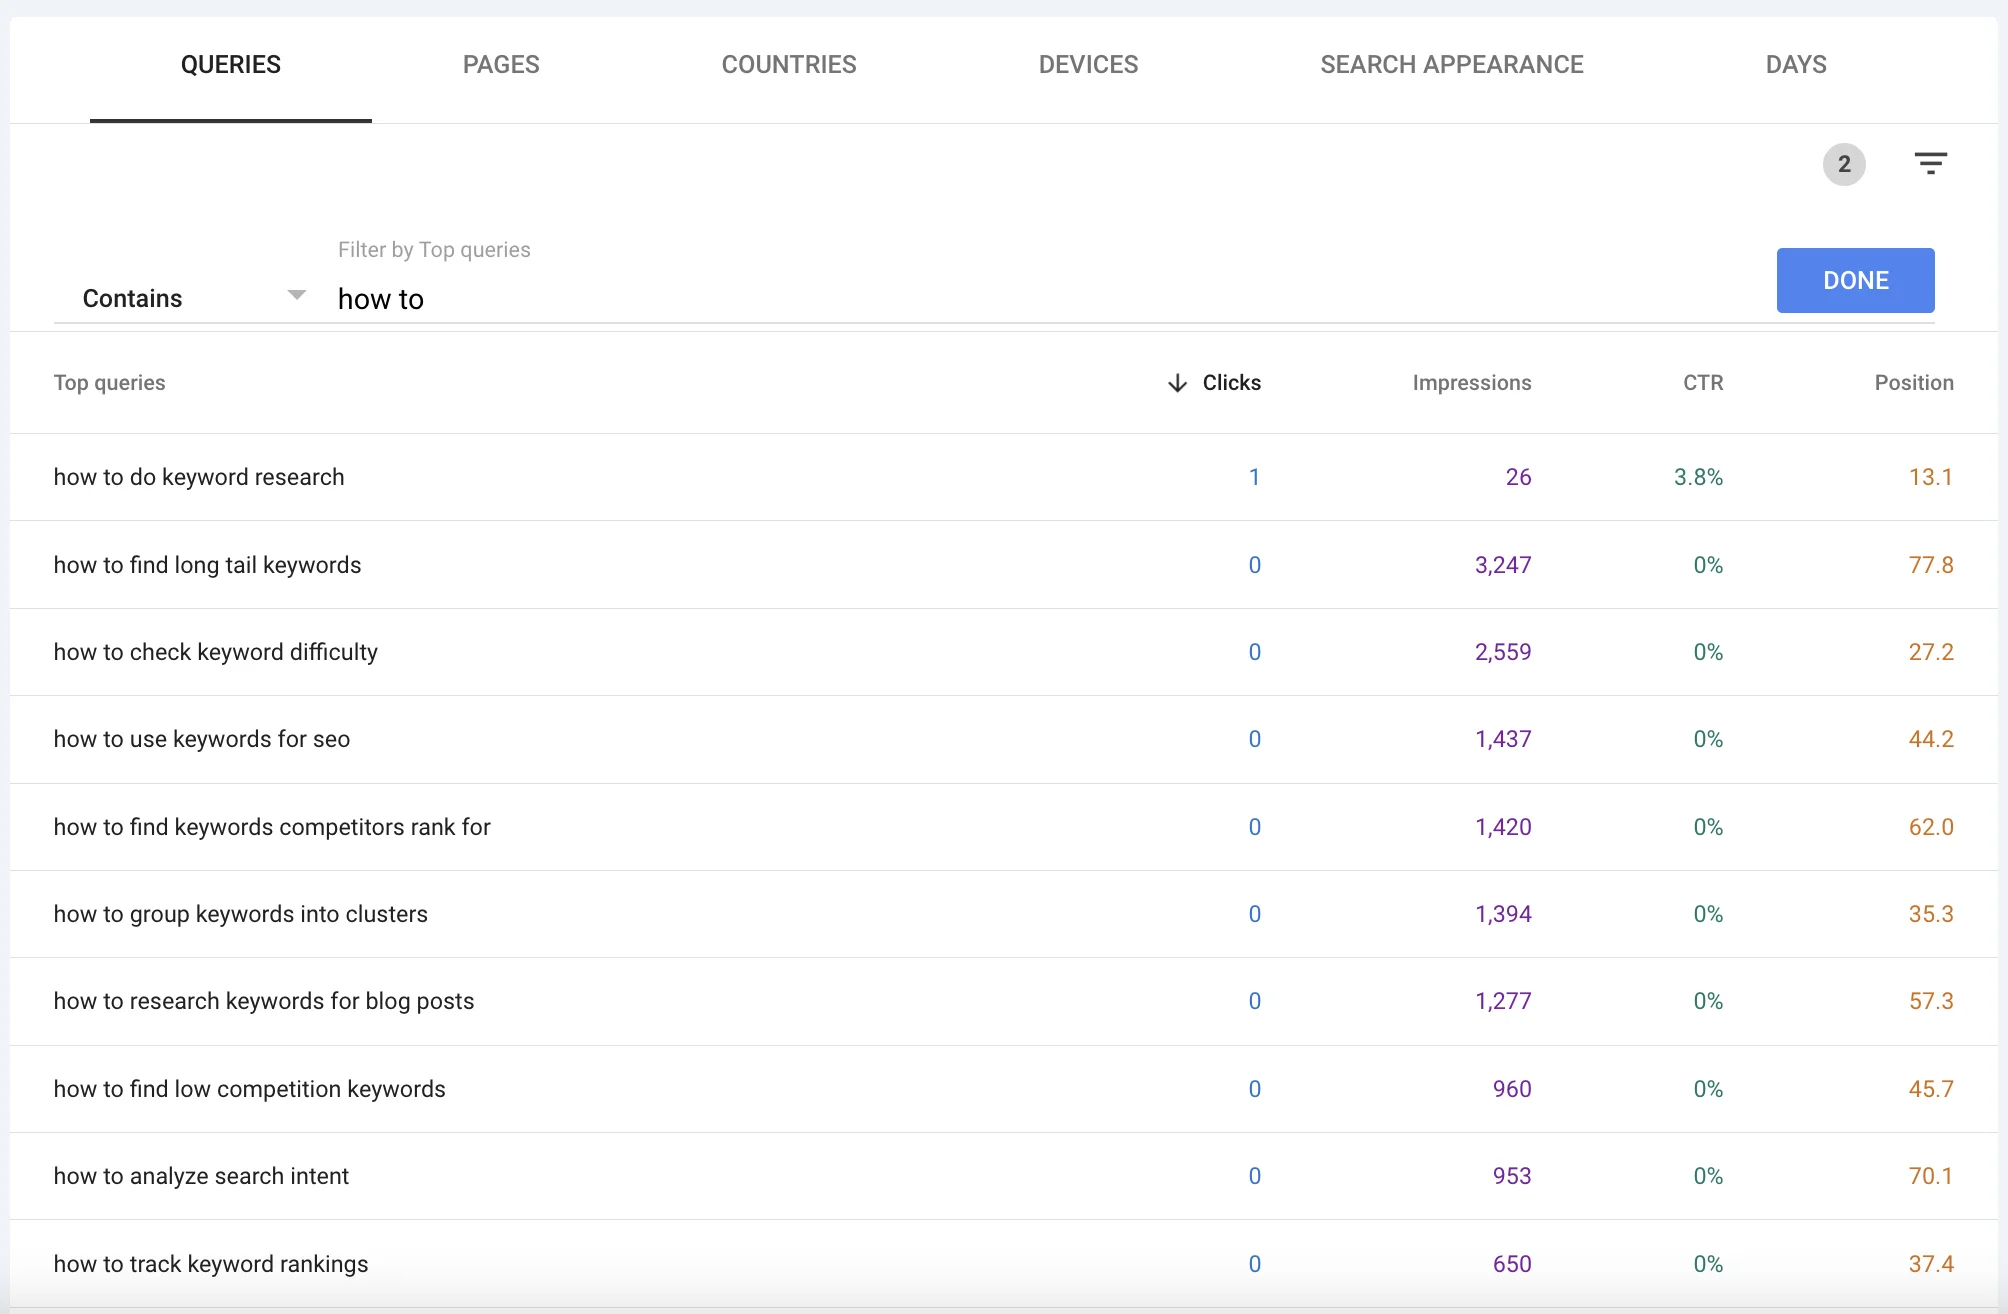
Each question query represents a real person with a real problem. If you're getting impressions for questions you haven't directly answered, consider creating content specifically addressing those questions.
Long-Tail Queries That Deserve Their Own Pages
Sort your queries by Impressions and look for specific, long-tail terms with decent volume but no dedicated content on your site.
For example, if you run a project management software company and see:
| Query | Impressions | Position |
|---|---|---|
| how to manage remote team projects | 2,000 | 15 |
| project management for marketing teams | 1,500 | 18 |
| agile vs waterfall for small teams | 1,200 | 20 |
Each of these could be a dedicated blog post. Your generic pages are picking up some impressions, but specialized content would rank much better and attract more qualified traffic. For B2B SaaS companies, these niche keywords often convert better than high-volume alternatives.
Building a Content Gap Hit List
Create a spreadsheet to track your content gap discoveries:
| Query Found in GSC | Current Page Ranking | Impressions | Content Recommendation |
|---|---|---|---|
| how to manage remote team projects | /features | 2,000 | New blog post: "Remote Team Project Management Guide" |
| project management for marketing teams | /blog/pm-basics | 1,500 | New landing page targeting marketing teams |
| agile vs waterfall for small teams | /about | 1,200 | New comparison blog post |
This becomes your content roadmap, prioritized by actual search demand from your audience. For a complete guide on turning this keyword list into an editorial calendar, see our content planning workflow.
Using BrightKeyword to Expand on GSC Discoveries
Once you identify a content gap in GSC, you can use BrightKeyword to expand that topic into a comprehensive keyword cluster.
For example, if GSC shows impressions for "remote team project management," BrightKeyword can discover:
- Related synonyms ("distributed team workflows", "virtual team coordination")
- Question keywords ("how to track remote employee productivity")
- Long-tail variations ("project management software for remote teams with time zones")
- LSI keywords that build topical authority
This combination of GSC's real-world data and BrightKeyword's AI-powered expansion ensures you create content that matches actual search demand while covering the topic comprehensively. You can also use ChatGPT to brainstorm additional keyword variations from your GSC discoveries.
Using GSC to Improve Existing Content
The fastest path to more traffic often isn't creating new content. It's improving what you already have. GSC shows you exactly which keywords each page ranks for, revealing opportunities to strengthen existing content.
Filtering Queries by Specific Page
To see all keywords driving traffic to a specific page:
- Go to the Pages tab in Performance
- Click on the URL you want to analyze
- Switch to the Queries tab
Now you see every query that page ranks for, with clicks, impressions, CTR, and position for each.
Finding Keywords to Add to Your Content
Look for queries with decent impressions that you haven't explicitly mentioned in your content:
Example scenario:
Your blog post about "email marketing best practices" ranks for:
- email marketing tips (primary target, position 5)
- how often to send marketing emails (position 12, 800 impressions)
- best time to send email campaigns (position 14, 600 impressions)
- email marketing for small business (position 18, 500 impressions)
Those last three queries show real demand, but if your content doesn't specifically address them, you're leaving traffic on the table.
Action plan:
- Add an H2 section about "How Often to Send Marketing Emails"
- Add an H2 or H3 about "Best Times to Send Email Campaigns"
- Include a section specifically addressing small business considerations
By expanding your content to cover these proven queries, you'll likely improve rankings for all of them.
Identifying Underperforming Sections
Sometimes a page ranks for queries it shouldn't. This indicates a content mismatch:
- If your "pricing" page ranks for "how to use [product]", users are confused
- If your blog post ranks for a competitor's product name, you might be losing conversions
When you spot these mismatches:
- Consider creating dedicated content for the mismatched query
- Or, add proper internal links to guide users to the right page
- Update meta descriptions to better match the content's actual focus
The "Thin Content" Signal
Pages with many impressions but poor positions across most queries often suffer from thin content. They're relevant enough to appear but not comprehensive enough to rank well.
If a page consistently ranks between 15-30 for multiple related queries, consider:
- Significantly expanding the content (double or triple the depth)
- Adding multimedia (images, videos, infographics)
- Including expert quotes, data, or original research
- Updating with more recent information
For pages with zero clicks and impressions in the single digits, updating might not be worth the effort. In these cases, content pruning (removing or consolidating weak pages) often delivers better results than trying to salvage underperforming content.
Content Refresh Workflow
Here's a systematic approach to improving content based on GSC data:
Monthly routine:
- Export your GSC Queries data for the last 3 months
- Group queries by the pages they rank for
- For each priority page, identify:
- Keywords ranking 5-15 that could move up with optimization
- High-impression keywords not explicitly covered in content
- Question keywords that could become new sections
- Update the page content
- Republish with a current date
- Track position changes over the following weeks
This systematic refresh often produces more traffic than new content creation, with less effort.
Analyzing Seasonal and Trending Keywords
Search behavior changes throughout the year. GSC helps you spot seasonal patterns and emerging trends so you can create or update content at the right time.
Using Date Comparisons to Spot Trends
GSC lets you compare two time periods side by side:
- At the top of the Performance report, click the date range
- Select "Compare"
- Choose your comparison (e.g., last 3 months vs. previous 3 months, or this year vs. last year)
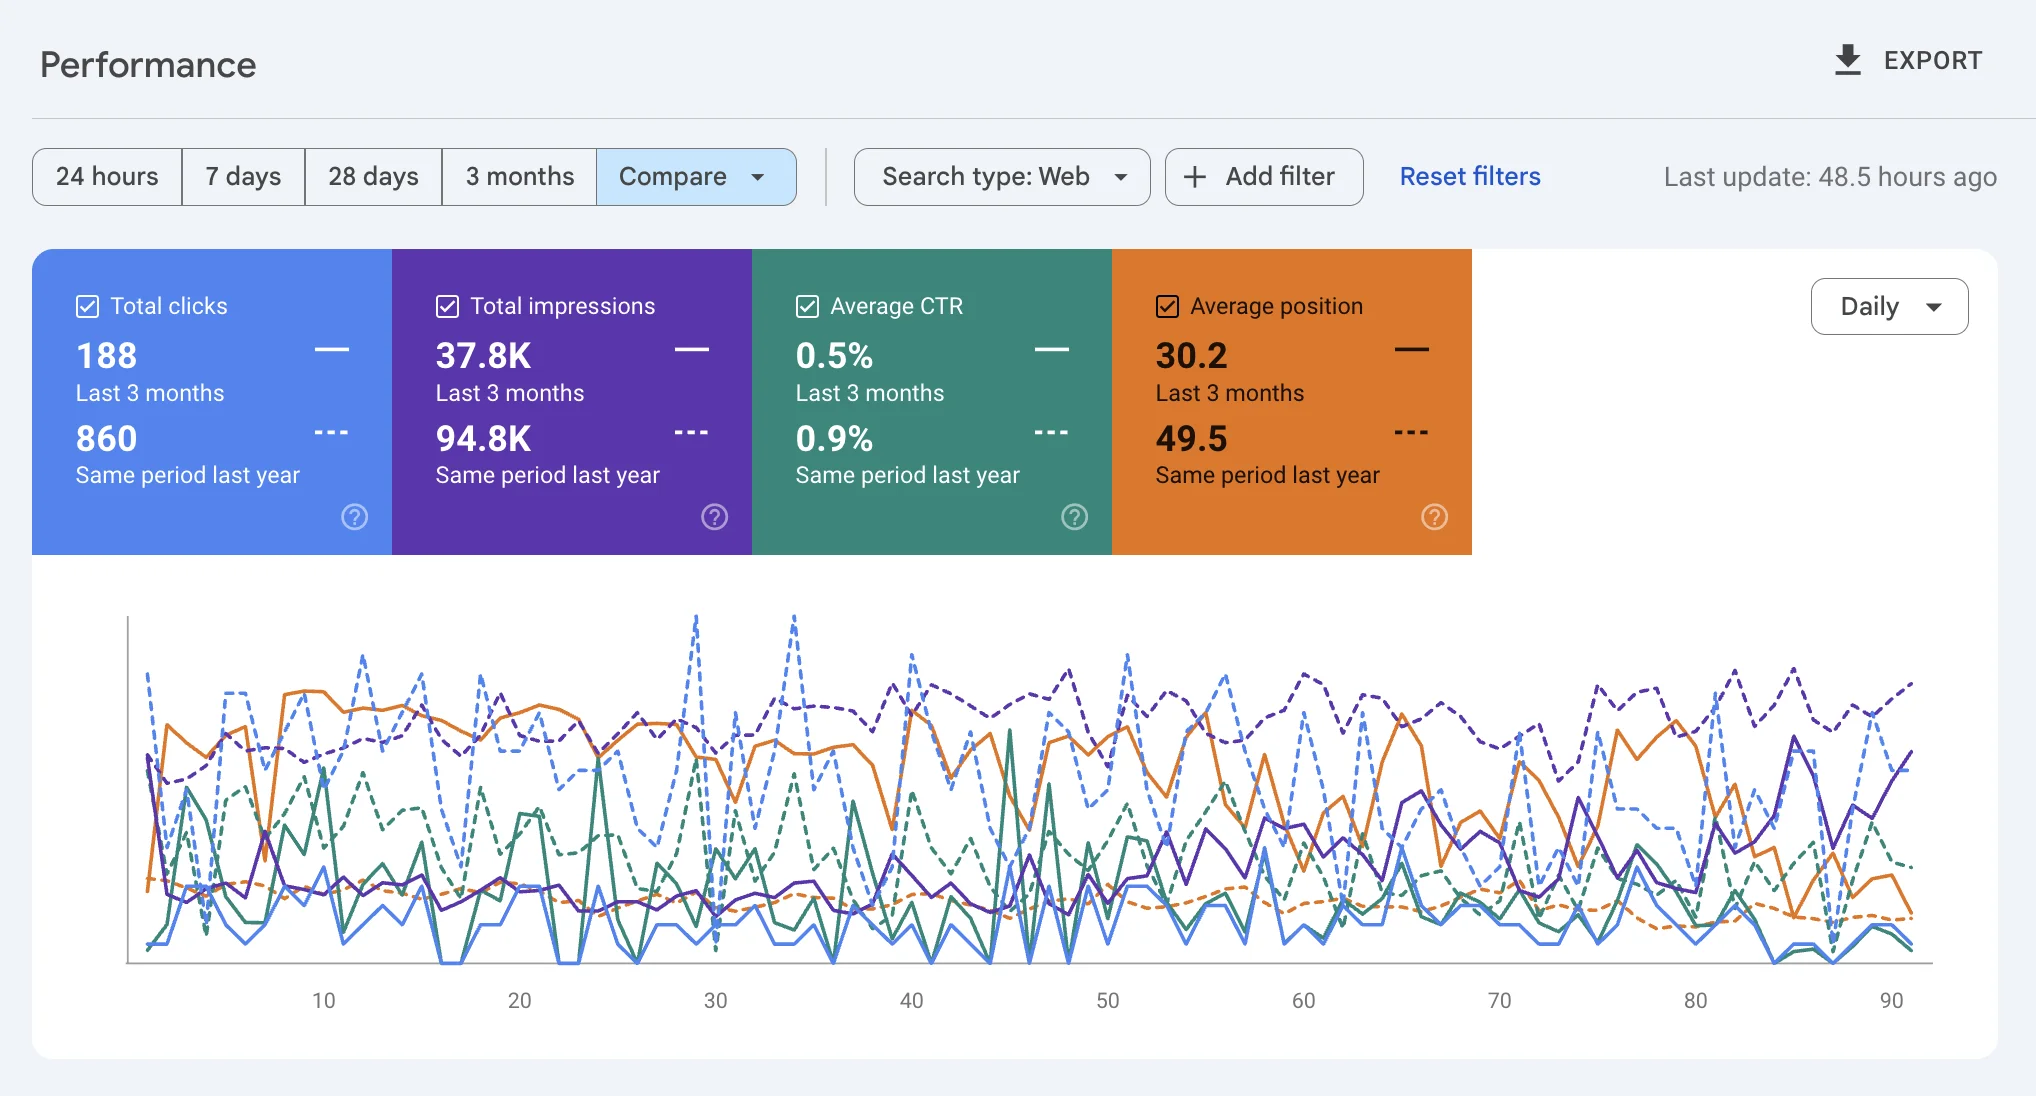
Now you can see which queries are growing (more impressions than the previous period) and which are declining.
Finding Rising Keywords
After setting up a comparison, look for queries with:
- Significantly higher impressions than the comparison period
- Improving positions (lower number = higher rank)
- Increasing CTR (people are clicking more)
These rising queries indicate growing interest. Double down on them:
- Create more comprehensive content on these topics
- Update existing content to be more current
- Build internal links to pages ranking for these terms
- Consider creating content clusters around trending themes
Identifying Seasonal Patterns
Compare the same period across different years to spot seasonal patterns:
- Q4 vs. Q4 previous year: Holiday-related searches
- Summer vs. summer: Vacation or seasonal product searches
- Month vs. same month last year: Annual patterns
If you see the same queries spike every November (for example), plan your content calendar to have fresh, optimized content ready before that spike.
Acting on Trends Before Competitors
When you notice a query growing in your GSC data, you have an advantage: you're already ranking for it. Others might not have noticed the trend yet.
Use this head start:
- Expand your content on the trending topic now
- Add related content that captures surrounding queries
- Update your page's title and meta description to match the trending phrasing
- Share the content on social media to build additional signals
By the time the trend peaks, your updated content should be firmly established in the top positions.
Planning Your Content Calendar with GSC Trends
Use 12+ months of GSC data to inform next year's content plan:
- Export queries for the full year
- Note which topics peaked in which months
- Plan to update or create content 2-3 months before historical peaks
- Build a calendar that aligns content creation with search demand patterns
This approach ensures your best content is fresh and optimized exactly when your audience needs it most.
Combining GSC Data with Keyword Research Tools
GSC tells you what's working now. Keyword research tools help you understand the broader opportunity and expand your strategy. The combination is more powerful than either alone.
Why GSC Data Alone Isn't Enough
GSC has limitations for keyword strategy:
- No volume data: GSC shows your impressions, not total search volume. A query might have 100 monthly impressions for your site but 10,000 total monthly searches.
- Only shows queries you rank for: You won't see keywords you're not appearing for at all.
- No difficulty metrics: GSC can't tell you how hard it will be to improve rankings.
- Limited competitive insight: You see your performance, not what competitors are doing.
Workflow: From GSC Discovery to Full Keyword Research
Here's how to combine GSC insights with keyword tools effectively:
Step 1: Export promising queries from GSC
Identify queries with high impressions, decent positions (8-20), and relevance to your business.
Step 2: Import into a keyword research tool
Take your GSC discoveries into BrightKeyword or another tool to get:
- Actual monthly search volume (not just your impressions)
- Competition level and difficulty scores
- Related keywords and variations you haven't considered
- Question keywords you can target in the same content
Step 3: Expand the keyword cluster
For each GSC discovery, build a full keyword cluster including:
- Primary keyword (from your GSC data)
- Synonyms and alternate phrasings
- Long-tail variations
- Question keywords for FAQ sections
Step 4: Validate external interest
Make sure your GSC queries have genuine search demand beyond your current audience. A query might give you impressions only because you rank #50 for a massive keyword, or because you're the only one covering a very niche topic with no demand.
Example: Expanding a GSC Discovery
Your GSC shows:
| Query | Impressions | Position |
|---|---|---|
| crm integration best practices | 1,200 | 14 |
This looks promising. You take it to BrightKeyword and discover:
- Primary: "crm integration best practices" (1,900 monthly searches, medium competition)
- Synonyms: "crm data integration tips", "how to integrate crm with other tools"
- Long-tail: "salesforce hubspot integration best practices", "crm email integration guide"
- Questions: "what are crm integration challenges", "how long does crm integration take"
Now you have a complete content brief. Instead of just adding "crm integration best practices" to your content, you can create a comprehensive guide that captures the entire topic cluster.
When to Trust GSC vs. Tools
| Situation | Trust GSC | Trust Tools |
|---|---|---|
| Finding what works now | ✓ | |
| Measuring your actual CTR | ✓ | |
| Discovering hidden opportunities | ✓ | |
| Estimating total search volume | ✓ | |
| Analyzing competition | ✓ | |
| Finding new topics to cover | ✓ | |
| Expanding keyword clusters | ✓ |
The best SEO strategies use both data sources. GSC grounds your research in reality; tools expand your horizons beyond what you've already achieved.
Tracking Progress Using GSC
Keyword research doesn't end when you publish content. GSC helps you measure whether your optimizations are working and identify what to adjust.
Monitoring Position Changes After Updates
When you optimize content for a specific keyword, track its progress:
- Note the keyword and its starting position/clicks/impressions
- Make your content update
- Wait 2-4 weeks for Google to recrawl and reevaluate
- Return to GSC and filter for that specific query
- Compare the new metrics to your baseline
What to expect:
- Position improvements often appear within 1-2 weeks for minor updates
- Significant position jumps can take 4-8 weeks
- If you don't see improvement after 8 weeks, the optimization may not have been enough
Creating a Keyword Tracking Dashboard
For ongoing monitoring, build a simple tracking spreadsheet:
| Keyword | Page | Baseline Date | Start Position | Current Position | Start Clicks | Current Clicks | Notes |
|---|---|---|---|---|---|---|---|
| email marketing tips | /blog/email-tips | Jan 15 | 8.2 | 4.5 | 245 | 892 | Added FAQ section |
| crm integration guide | /resources/crm | Jan 22 | 14.7 | 11.3 | 42 | 78 | Expanded content by 1500 words |
Update this monthly to track which optimizations are working.
Setting Up Regular GSC Reviews
Make GSC analysis part of your routine:
Weekly (10 minutes):
- Check for any significant traffic drops that might indicate problems
- Note any new keywords appearing in your top queries
- Review the Index Coverage report for any pages stuck in "Crawled - not indexed"
Monthly (30-60 minutes):
- Export the last 3 months of query data
- Compare to the previous 3 months
- Identify new low-hanging fruit opportunities
- Update your tracking spreadsheet
- Plan content updates for the coming month
Quarterly (2-3 hours):
- Deep dive into year-over-year trends
- Identify seasonal patterns to plan for
- Review which content updates delivered results
- Refine your keyword and content strategy based on data
Using GSC Alongside Analytics
GSC tells you how users found you. Your analytics platform (Google Analytics, etc.) tells you what they did after arriving. Combine both for the full picture:
- Find high-click keywords in GSC
- Check the landing pages for those keywords
- In Analytics, measure the conversion rate for those pages
- Prioritize optimizing pages that drive keywords with high traffic AND high conversion potential
A keyword driving 1,000 clicks but no conversions might be less valuable than one driving 100 clicks with a 5% conversion rate.
Frequently Asked Questions
How long does Google Search Console store data?
GSC stores 16 months of data. You can access queries, impressions, clicks, and position data going back 16 months from the current date. For longer historical analysis, export your data regularly and store it separately.
Why do my GSC impressions and clicks not match my Analytics traffic?
GSC counts impressions (when your page appeared in results) and clicks (when someone clicked). Analytics counts sessions and users. The metrics measure different things. Also, GSC only tracks organic search, while Analytics includes all traffic sources. Slight discrepancies are normal.
What's a good click-through rate in GSC?
CTR varies dramatically by position. Position 1 averages around 25-30% CTR, while position 10 might see 2-3%. More importantly, compare your CTR to your own historical performance rather than industry averages. If your CTR is improving over time, you're heading in the right direction.
How often should I check Google Search Console?
Weekly quick checks catch problems early. Monthly deep dives identify optimization opportunities. More frequent checking rarely provides actionable insights since ranking changes take time to appear.
Can GSC tell me keyword difficulty or competition level?
No. GSC only shows your performance for queries where you already appear. For difficulty metrics and competitive analysis, you need a third-party keyword research tool like BrightKeyword.
Why do some keywords show in GSC but not in my keyword research tool?
GSC shows actual queries users typed. Keyword tools show queries with sufficient search volume to appear in their databases. Very long-tail or niche queries might not appear in tools but still show in GSC if you're ranking for them.
How accurate is the position data in GSC?
GSC shows the average position across all searches. Your position might vary by device, location, and personalization. The average is useful for tracking trends but may not match a specific position check you do manually.
What's the difference between GSC impressions and search volume?
Impressions are how many times YOUR pages appeared for that query. Search volume is the total number of times the query is searched each month by everyone. If a keyword has 10,000 monthly searches and you rank #50, your impressions might only be 100.
Start Mining Your GSC Data Today
Your Google Search Console data contains insights that no amount of third-party research can replicate. It shows you what's already working, where you're almost succeeding, and what your actual audience is searching for.
The strategies in this guide can deliver results within weeks:
- Low-hanging fruit keywords can often be boosted with content updates in a single afternoon
- Content gaps become clear roadmaps for new pages that are almost guaranteed to rank
- Seasonal trends help you time your content perfectly for maximum impact
- Progress tracking ensures you learn from every optimization and continuously improve
Here's your action plan for this week:
- Log into GSC and filter for position 8-20 keywords with high impressions
- Pick your top 3 opportunities based on relevance and potential traffic
- Update those pages by adding sections that directly address the target queries
- Set a reminder to check progress in 4 weeks
Then, take your best GSC discoveries and expand them with BrightKeyword to find the related keywords, questions, and variations that turn good content into comprehensive resources.
The keywords you need are already in your data. Now it's time to mine that gold.