Your Site Loads Fast. Google Says It Doesn't. Now What?
You open PageSpeed Insights, expecting a pat on the back. Instead, you see red numbers, failing grades, and a list of cryptic metrics: LCP, CLS, INP. Your site feels fast when you use it. Your analytics show decent traffic. But Google is telling you something is wrong.
Here's the problem: what feels fast to you on your office fiber connection is not what your users experience on mobile networks. And Google measures what real users experience, not what you see.
Core Web Vitals have become one of the most misunderstood ranking factors in SEO. Some site owners panic over every yellow warning. Others ignore them entirely because "user experience is subjective." Both are wrong.
The data is clear: sites that pass Core Web Vitals rank 28% higher than those that fail. A 0.2-second improvement in LCP leads to a 15% increase in conversion rates. These aren't theoretical benefits. They're measurable business outcomes.
In this guide, you'll learn exactly what Core Web Vitals measure, how to diagnose failures, and the specific fixes that actually move the needle. No vague advice about "optimizing performance." Concrete actions you can implement this week.
Your site speed isn't a mystery. It's a metric. Let's fix it.
What Are Core Web Vitals?
Core Web Vitals are Google's standardized metrics for measuring user experience on the web. They focus on three aspects of page performance: loading speed, visual stability, and interactivity.
The Three Metrics That Matter
| Metric | What It Measures | Good | Needs Improvement | Poor |
|---|---|---|---|---|
| LCP (Largest Contentful Paint) | How fast the main content loads | ≤ 2.5s | 2.5s - 4s | > 4s |
| CLS (Cumulative Layout Shift) | How much the page layout shifts unexpectedly | ≤ 0.1 | 0.1 - 0.25 | > 0.25 |
| INP (Interaction to Next Paint) | How fast the page responds to user input | ≤ 200ms | 200ms - 500ms | > 500ms |
TL;DR: LCP measures loading, CLS measures stability, INP measures responsiveness. Pass all three, and Google considers your page to have good user experience.
INP Replaced FID in March 2024
If you've been tracking Core Web Vitals for a while, you might remember First Input Delay (FID). Google officially replaced FID with INP on March 12, 2024.
Why the change? FID only measured the first interaction. A page could score perfectly on FID while being frustratingly slow for every subsequent click. INP evaluates all interactions throughout the page's lifetime, providing a more accurate picture of real user experience.
This matters because many sites that "passed" Core Web Vitals under FID now fail under INP. If you haven't checked your metrics recently, you might have a problem you don't know about.
Where Google Gets This Data
Google measures Core Web Vitals from two sources:
Field data (CrUX): Real measurements from Chrome users who visit your site. This is what Google uses for rankings. You need enough traffic to appear in the Chrome User Experience Report.
Lab data (Lighthouse): Simulated tests run in a controlled environment. Useful for debugging but not used directly for rankings.
I've seen site owners obsess over their Lighthouse scores while ignoring field data. That's backwards. Fix what real users experience, not what a simulation shows.
How to Check Your Core Web Vitals
Before you can fix problems, you need to find them. Here are the tools that actually matter.
Method 1: PageSpeed Insights (Best Starting Point)
Go to PageSpeed Insights and enter your URL. The report shows both field data (from real users) and lab data (simulated).
What to look for:
- Green scores: You're passing. Focus elsewhere.
- Yellow scores: Needs improvement. Worth fixing but not urgent.
- Red scores: Failing. This is hurting your rankings and conversions.
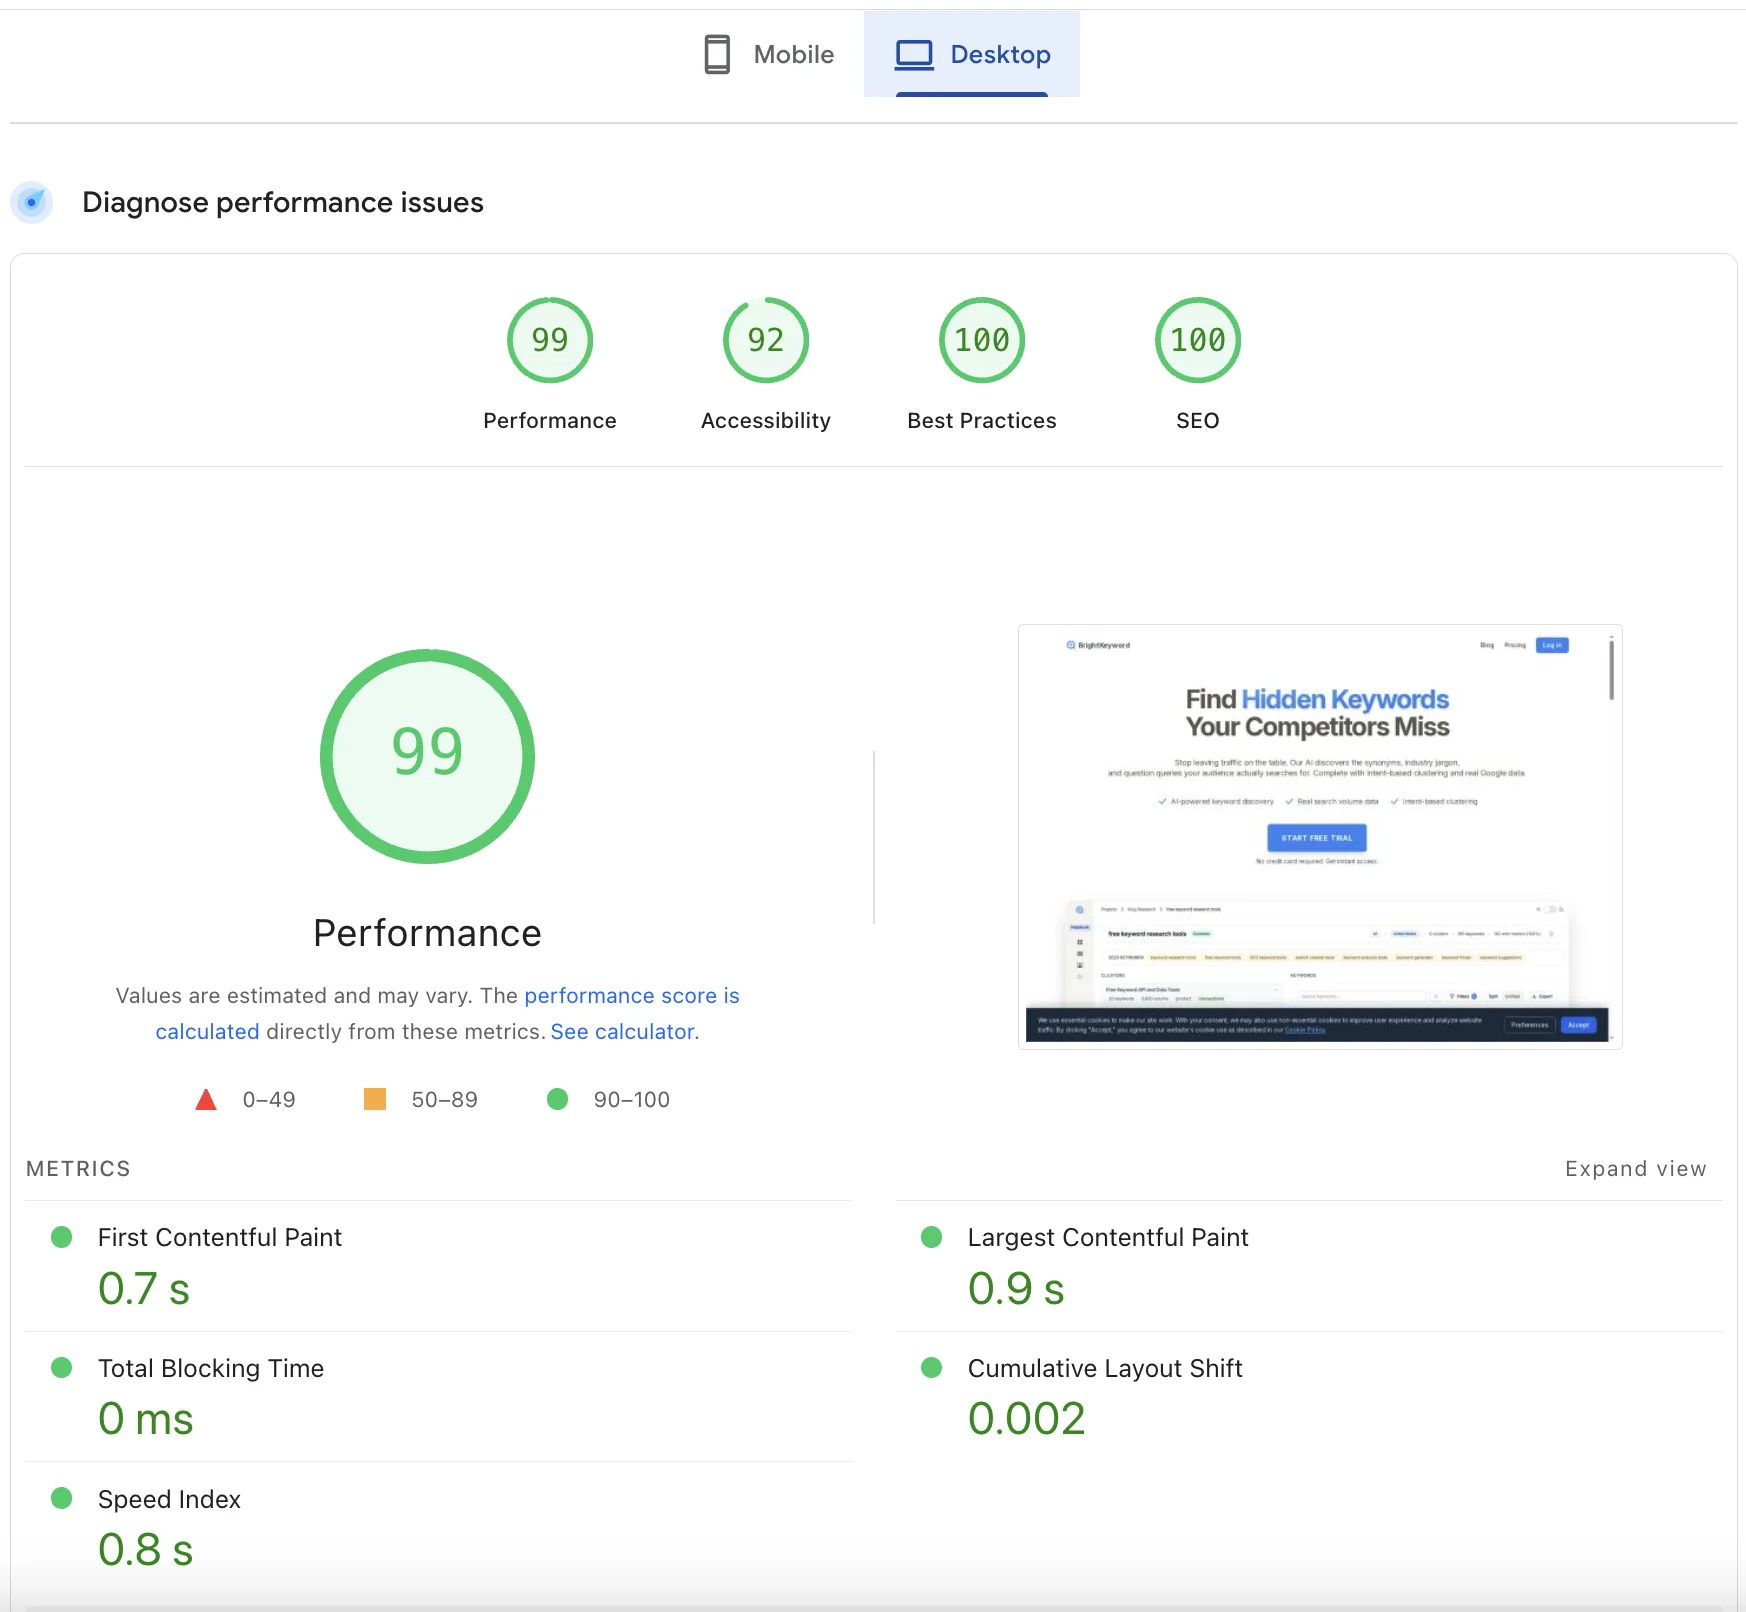
The screenshot above shows what passing Core Web Vitals look like on desktop: a performance score of 99, LCP under 1 second, and CLS near zero. This is your target state.
Method 2: Google Search Console
For site-wide data, Search Console's Core Web Vitals report groups your URLs by status:
- Go to Search Console > Experience > Core Web Vitals
- Review mobile and desktop reports separately
- Click into "Poor" or "Needs improvement" groups to see affected URLs
Search Console shows patterns. If all your blog posts have poor LCP, the problem is likely your template, not individual pages.
Method 3: Chrome DevTools (For Debugging)
When you need to understand why a metric is failing:
- Open Chrome DevTools (F12)
- Go to the Performance tab
- Record a page load
- Look for long tasks, layout shifts, and slow resource loading
This is where you'll find the specific JavaScript or images causing problems.
The Desktop vs Mobile Gap
Here's something I see constantly: sites that score 95+ on desktop but struggle on mobile.
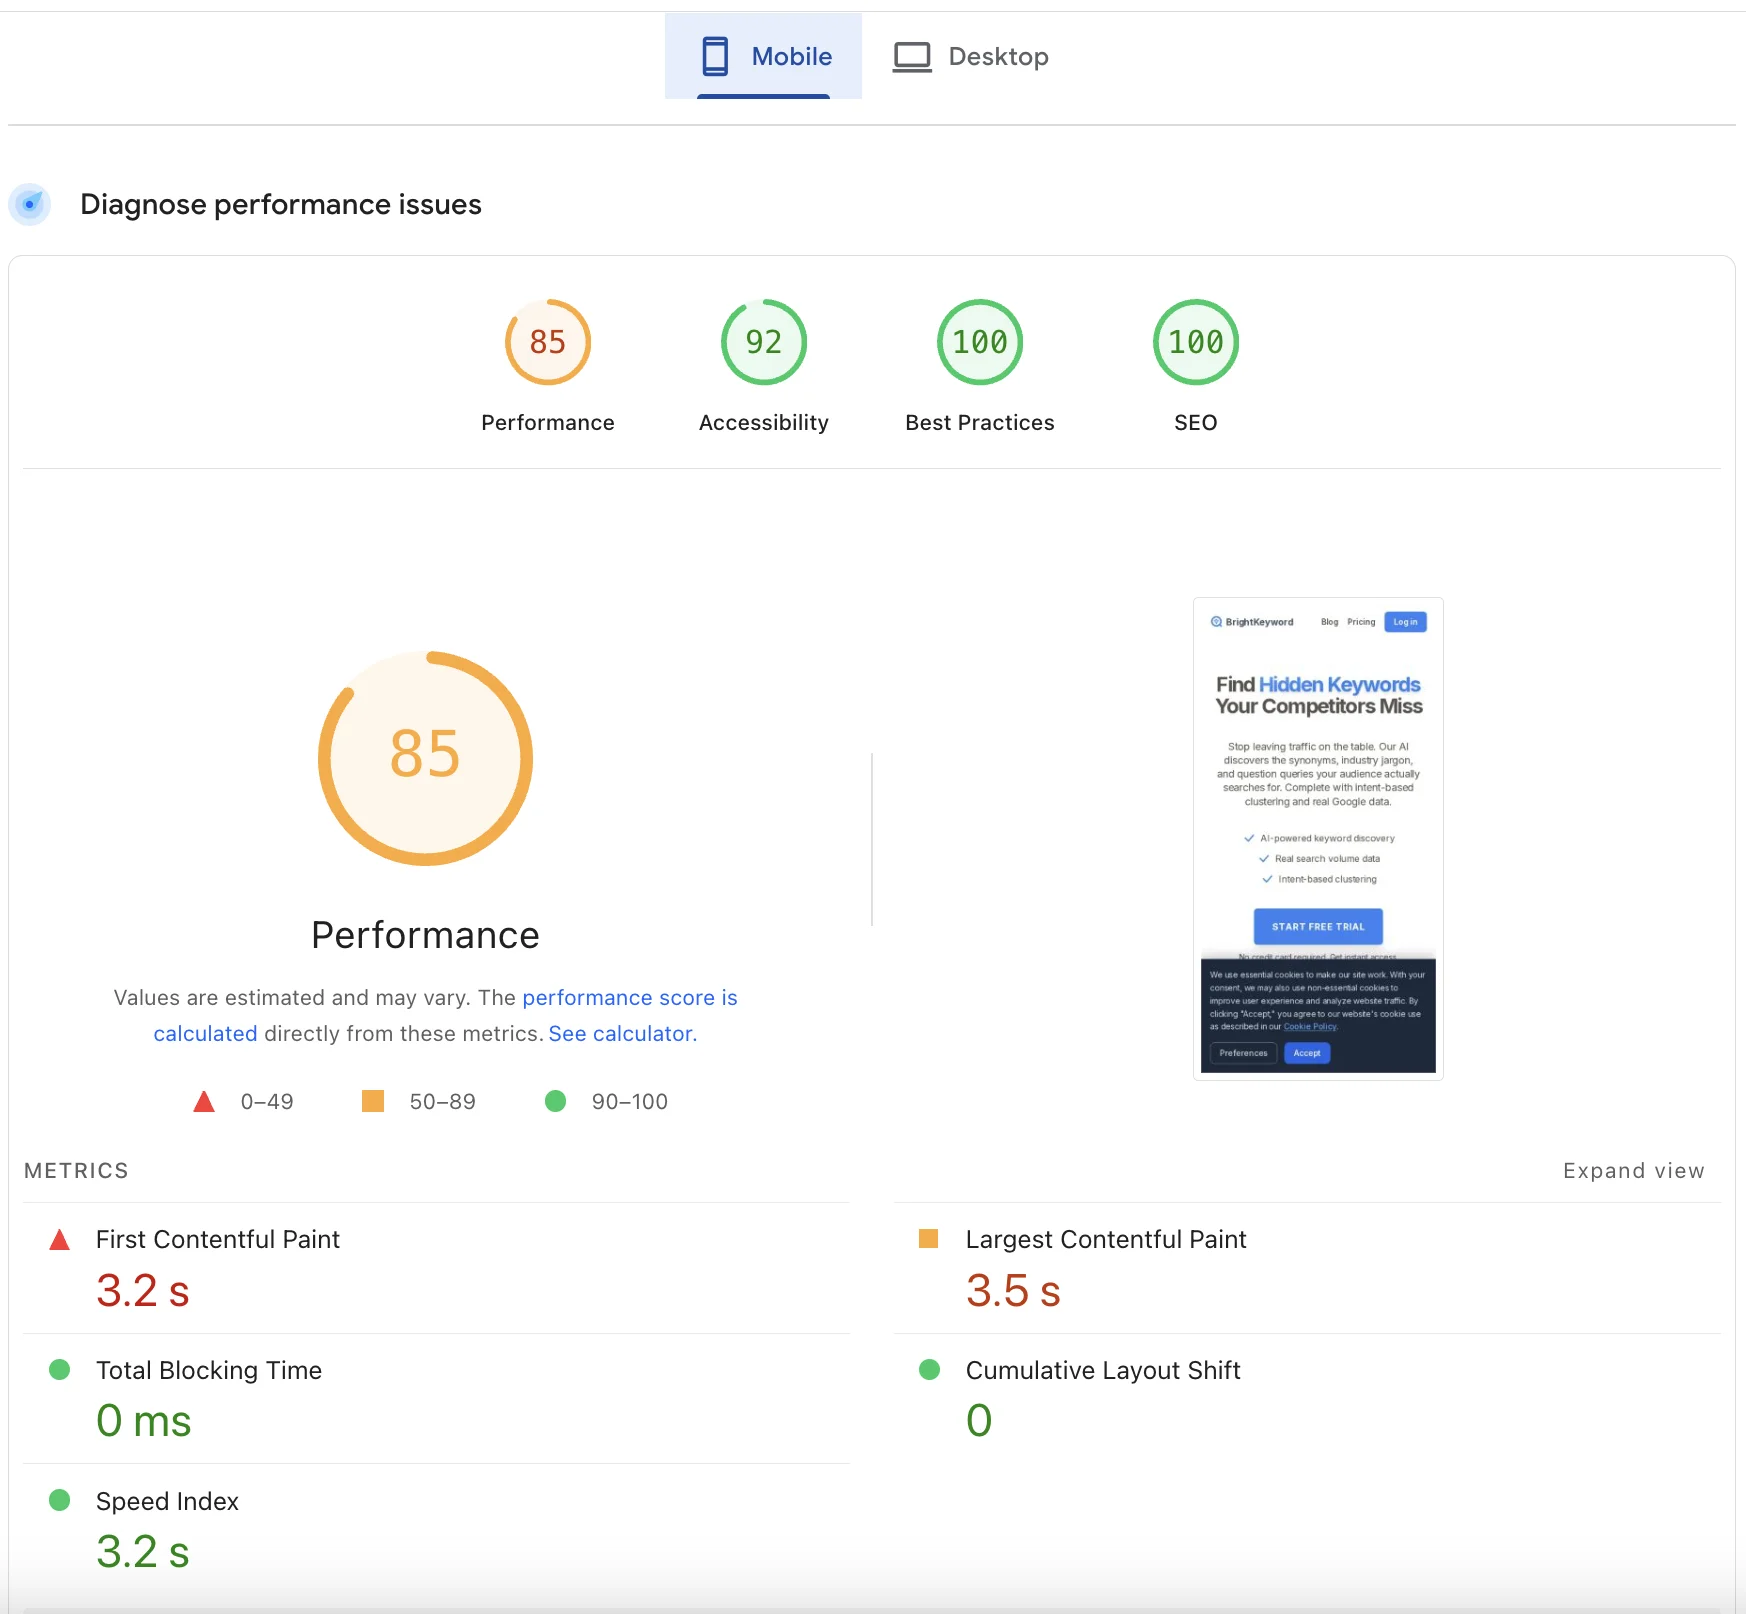
The same site that scores 99 on desktop might score 85 on mobile. Why? Mobile networks are slower, mobile CPUs are weaker, and mobile browsers have less memory. The LCP that takes 0.9 seconds on desktop takes 3.5 seconds on mobile.
This gap matters because 75% of mobile sites fail Core Web Vitals assessments, compared to only 45% of desktop sites. And Google uses mobile-first indexing, so your mobile scores are what count for rankings.
Check both. Fix mobile first.
Fixing Largest Contentful Paint (LCP)
LCP measures how long it takes for the largest visible element to load. Usually, this is your hero image, heading text, or main content block.
TL;DR: Most LCP problems come from slow server response, unoptimized images, or render-blocking resources. Fix those three, and LCP usually fixes itself.
Common LCP Culprits
| Problem | Impact | Fix |
|---|---|---|
| Slow server response (TTFB > 600ms) | Delays everything | Upgrade hosting, add caching, use CDN |
| Large unoptimized images | Slow to download | Compress images, use WebP, implement lazy loading |
| Render-blocking CSS/JS | Browser waits to render | Inline critical CSS, defer non-critical JS |
| Web fonts blocking render | Text invisible until font loads | Use font-display: swap |
| Client-side rendering | Content generated by JavaScript | Pre-render or use SSR (see our JavaScript SEO guide) |
Fix 1: Optimize Your LCP Element
First, identify what your LCP element actually is. In PageSpeed Insights, scroll to the "Largest Contentful Paint element" diagnostic.
If it's an image:
- Compress it (use tools like Squoosh or ImageOptim)
- Convert to WebP format (30-50% smaller than JPEG)
- Add explicit width and height attributes
- Use fetchpriority="high" for the hero image
- Remove lazy loading from above-the-fold images
If it's text:
- Ensure fonts load quickly with font-display: swap
- Preload critical fonts with <link rel="preload">
- Consider using system fonts for headings
Fix 2: Improve Server Response Time
Your server's Time to First Byte (TTFB) is the foundation of LCP. If your server takes 2 seconds to respond, you can't have LCP under 2.5 seconds.
Quick wins:
- Enable server-side caching
- Use a CDN (Cloudflare, Fastly, CloudFront)
- Upgrade from shared hosting if TTFB exceeds 800ms
- Optimize database queries that slow down page generation
If you're planning a hosting migration, use our SEO site migration checklist to avoid losing rankings during the transition.
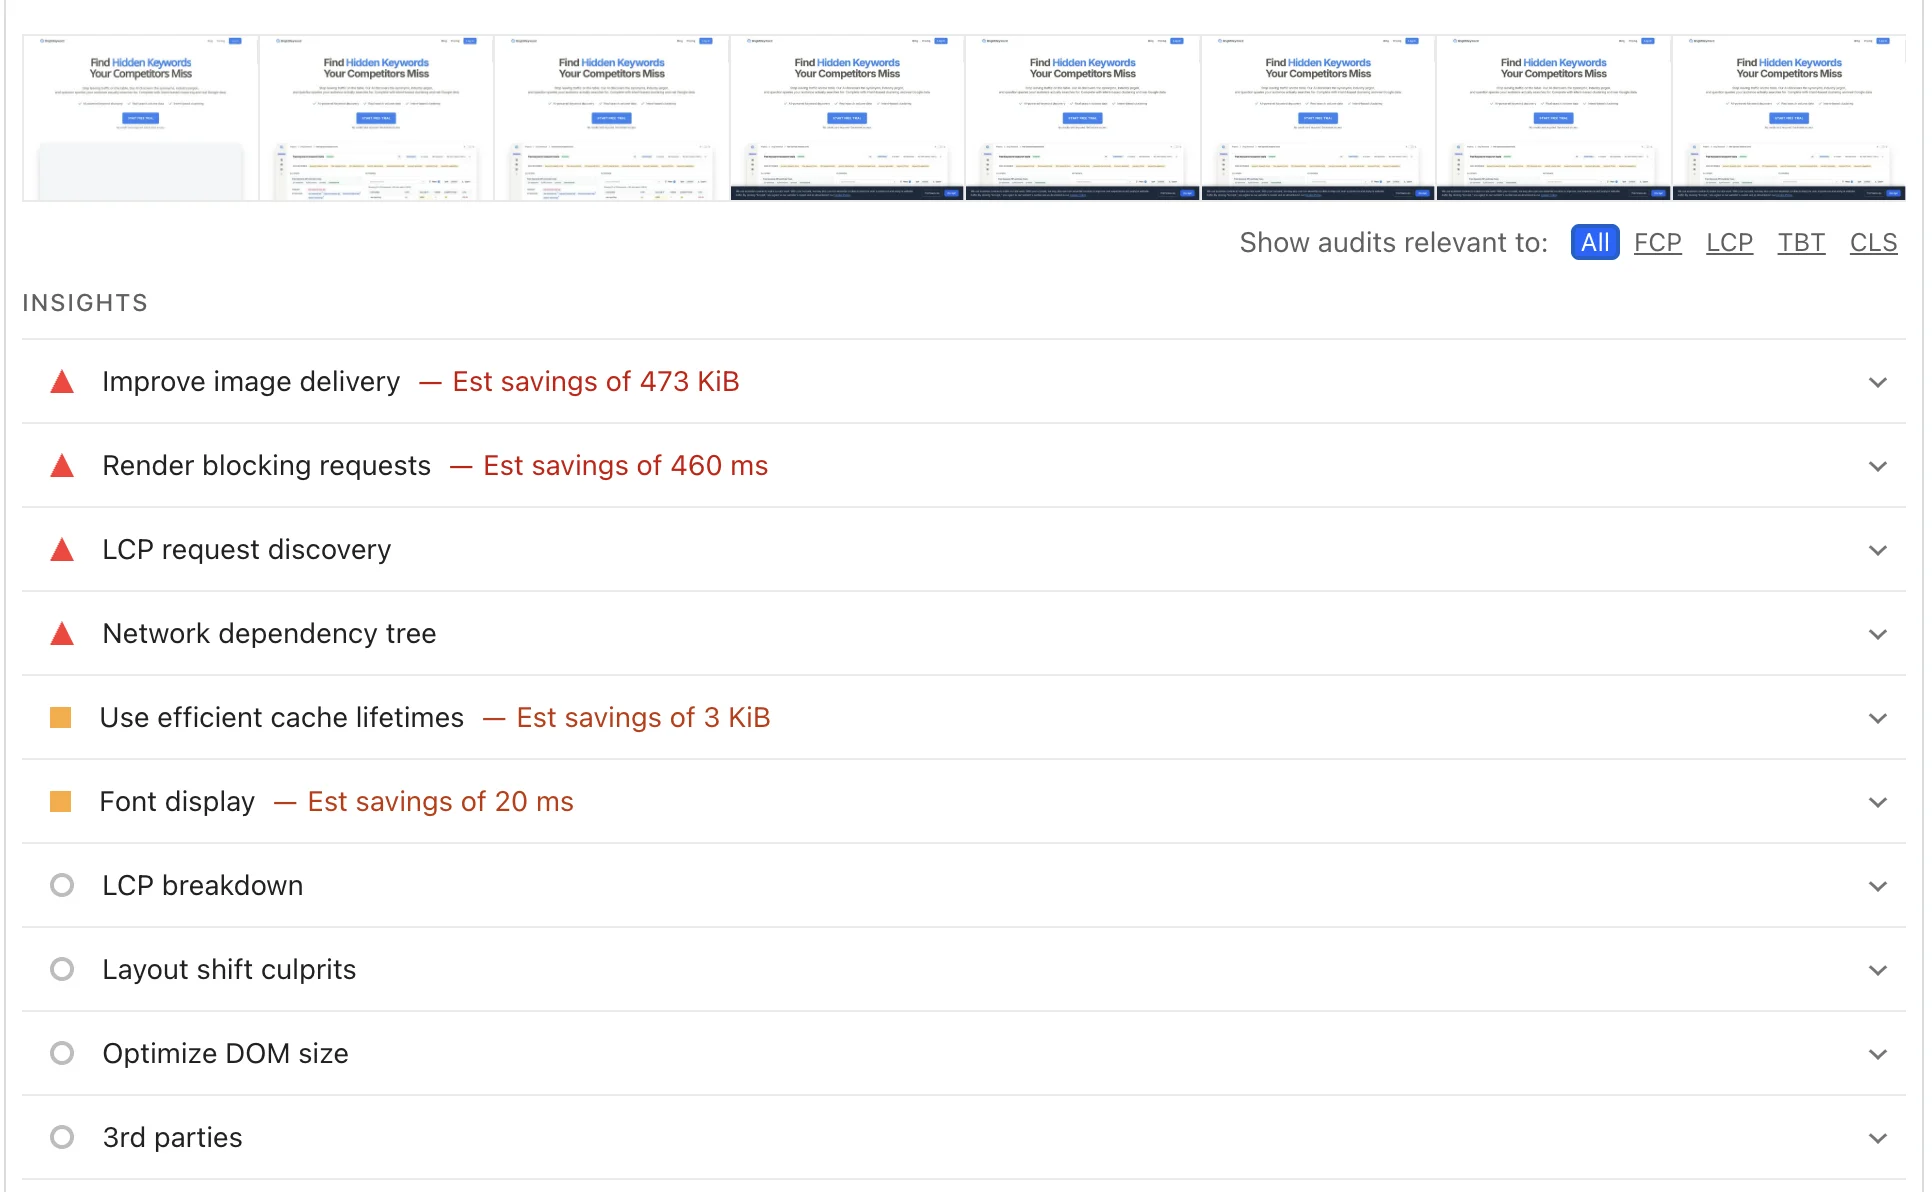
Fix 3: Eliminate Render-Blocking Resources
Check PageSpeed Insights for "Eliminate render-blocking resources." Each file listed here is making the browser wait before showing content.
For CSS:
- Inline critical CSS directly in the <head>
- Load non-critical CSS asynchronously
- Remove unused CSS (tools like PurgeCSS help)
For JavaScript:
- Add defer attribute to script tags
- Move non-essential scripts to the bottom of <body>
- Split large bundles into smaller chunks
Case Study: TechFlow Marketplace
A B2B marketplace reduced their LCP from 3.2 seconds to 0.8 seconds by implementing these fixes. The result? Organic traffic increased 245% within six months, and bounce rate dropped from 68% to 34%.
The biggest impact came from three changes: adding a CDN, compressing their hero images, and deferring non-critical JavaScript.
Fixing Cumulative Layout Shift (CLS)
CLS measures unexpected layout shifts. You know the experience: you're about to tap a button, and suddenly an ad loads above it, pushing the button down. You tap the ad instead. Frustrating.
TL;DR: CLS problems almost always come from images without dimensions, late-loading ads, or web fonts causing text reflow. Reserve space for dynamic content before it loads.
Common CLS Culprits
| Problem | Impact | Fix |
|---|---|---|
| Images without dimensions | Browser doesn't know how much space to reserve | Add width and height attributes |
| Ads and embeds loading late | Content shifts when ad container appears | Reserve space with CSS |
| Web fonts causing reflow | Text resizes when font swaps in | Use font-display: optional or match fallback sizing |
| Dynamic content injection | New elements push existing content down | Reserve space or append below viewport |
| Animations triggering layout | CSS changes cause reflow | Use transform instead of top/left |
Fix 1: Always Specify Image Dimensions
This is the easiest CLS fix and the most commonly missed.
<!-- Bad: No dimensions, causes layout shift -->
<img src="hero.webp" alt="Hero image">

<!-- Good: Dimensions specified, space reserved -->
<img src="hero.webp" alt="Hero image" width="800" height="400">
Modern browsers use these dimensions to calculate aspect ratio and reserve space before the image loads. Even with responsive images, always include width and height.
Fix 2: Reserve Space for Ads and Embeds
Ads are CLS nightmares because they load asynchronously and often have variable heights.
Solution: Use CSS to reserve the expected space:
.ad-container {
  min-height: 250px; /* Match your ad unit height */
  background: #f5f5f5; /* Optional: show placeholder */
}
For embeds (YouTube, Twitter, etc.), most embed codes don't include dimensions. Wrap them in a container with a fixed aspect ratio:
.video-container {
  position: relative;
  padding-bottom: 56.25%; /* 16:9 aspect ratio */
  height: 0;
}
.video-container iframe {
  position: absolute;
  top: 0;
  left: 0;
  width: 100%;
  height: 100%;
}
Fix 3: Prevent Font-Induced Layout Shift
Web fonts can cause layout shift in two ways:
- FOIT (Flash of Invisible Text): Text hidden until font loads
- FOUT (Flash of Unstyled Text): Fallback font shown, then swapped
Both cause CLS if the fonts have different metrics. The fix depends on your priorities:
If you can tolerate brief fallback text:
@font-face {
  font-family: 'CustomFont';
  src: url('font.woff2') format('woff2');
  font-display: swap; /* Show fallback immediately, swap when loaded */
}
If you want zero CLS from fonts:
@font-face {
  font-family: 'CustomFont';
  src: url('font.woff2') format('woff2');
  font-display: optional; /* Use custom font only if cached */
}
The optional value eliminates font-related CLS entirely but means first-time visitors see the fallback font.
Real-World CLS Example
Look at a site with 0.124 CLS (needs improvement). The main culprit is often one of two things:
- A late-loading banner or popup that pushes content down
- Images in the main content area without specified dimensions
Finding CLS issues is straightforward in Chrome DevTools:
- Open DevTools > Performance tab
- Enable "Screenshots" and "Web Vitals"
- Record a page load
- Look for red "Layout Shift" markers in the timeline
- Click to see which element shifted
Fix the elements causing the largest shifts first. Often, fixing one or two issues drops CLS below the 0.1 threshold.
Fixing Interaction to Next Paint (INP)
INP measures how quickly your page responds to user interactions. Click a button. How long until something visible happens? That's what INP captures.
TL;DR: INP problems are JavaScript problems. Long-running scripts block the main thread and delay response to user input. Break up work, defer non-essential code, and avoid layout thrashing.
Common INP Culprits
| Problem | Impact | Fix |
|---|---|---|
| Long JavaScript tasks (>50ms) | Block main thread, delay input response | Break into smaller chunks with setTimeout or requestIdleCallback |
| Heavy event handlers | Slow response to clicks/taps | Optimize handler code, debounce frequent events |
| Layout thrashing | Reading then writing DOM in loops | Batch reads, then batch writes |
| Third-party scripts | Analytics, ads, chat widgets blocking thread | Load asynchronously, delay until interaction |
| Large JavaScript bundles | Long parse and compile time | Code splitting, lazy loading |
Fix 1: Break Up Long Tasks
The browser's main thread handles both JavaScript and user input. If JavaScript runs for 200ms straight, user input waits 200ms for a response.
Before (blocking):
// Processes all items at once, blocks for 500ms
items.forEach(item => processItem(item));
After (chunked):
// Processes in chunks, yields to browser between chunks
function processChunk(items, index = 0) {
  const CHUNK_SIZE = 50;
  const end = Math.min(index + CHUNK_SIZE, items.length);

  for (let i = index; i < end; i++) {
    processItem(items[i]);
  }

  if (end < items.length) {
    setTimeout(() => processChunk(items, end), 0);
  }
}
processChunk(items);
Fix 2: Defer Third-Party Scripts
Analytics, chat widgets, and ad scripts often have massive INP impact. They load synchronously, run heavy initialization, and add event listeners that compete with your code.
Defer until after page load:
<!-- Load after page becomes interactive -->
<script>
  window.addEventListener('load', () => {
    const script = document.createElement('script');
    script.src = 'https://analytics.example.com/tracker.js';
    document.body.appendChild(script);
  });
</script>
Or defer until user interaction:
<script>
  const loadAnalytics = () => {
    // Load analytics only after first interaction
    const script = document.createElement('script');
    script.src = 'https://analytics.example.com/tracker.js';
    document.body.appendChild(script);

    // Remove listeners after loading
    ['mousemove', 'touchstart', 'scroll'].forEach(event => {
      document.removeEventListener(event, loadAnalytics);
    });
  };

  ['mousemove', 'touchstart', 'scroll'].forEach(event => {
    document.addEventListener(event, loadAnalytics, { once: true });
  });
</script>
Fix 3: Avoid Layout Thrashing
Layout thrashing happens when you read layout properties (like offsetHeight) and then immediately write layout-affecting styles. Each read-write cycle forces the browser to recalculate layout.
Before (thrashing):
// Forces layout recalculation on every iteration
elements.forEach(el => {
  el.style.height = el.offsetHeight + 10 + 'px'; // Read, then write
});
After (batched):
// Read all values first
const heights = elements.map(el => el.offsetHeight);

// Then write all values
elements.forEach((el, i) => {
  el.style.height = heights[i] + 10 + 'px';
});
Case Study: T-Mobile
T-Mobile's web performance team achieved a 60% improvement in visit-to-order conversion rate after optimizing their Core Web Vitals. A significant portion of the improvement came from reducing main thread blocking time, which directly improved INP scores.
Their approach: identify the slowest interactions using Real User Monitoring (RUM) data, then optimize those specific code paths. Not a blanket "make everything faster" approach, but targeted fixes for the interactions that mattered most to their business.
Prioritizing Your Fixes
You've diagnosed problems across LCP, CLS, and INP. Where do you start? Use this framework.
Priority Matrix
| Metric Status | Business Impact | Fix Priority |
|---|---|---|
| Red (failing) + High-traffic pages | Direct ranking and conversion impact | Immediate |
| Red (failing) + Low-traffic pages | Ranking impact on growth pages | High |
| Yellow (needs improvement) + High-traffic | Opportunity for incremental gains | Medium |
| Yellow (needs improvement) + Low-traffic | Monitor, fix when convenient | Low |
Quick Wins vs Deep Fixes
Quick wins (implement this week):
- Add width and height to images
- Add font-display: swap to web fonts
- Defer non-critical JavaScript with defer attribute
- Enable compression (gzip/brotli) if not already
- Add CDN caching for static assets
Deep fixes (plan for next sprint):
- Refactor render-blocking CSS
- Implement code splitting for JavaScript
- Migrate to faster hosting
- Rewrite slow database queries
- Remove or replace heavy third-party scripts
Measure, Fix, Verify
- Baseline: Document current CWV scores for key pages
- Fix: Implement changes one category at a time
- Wait: Field data takes 28 days to fully update in CrUX
- Verify: Check if metrics improved or if new issues appeared
Don't deploy everything at once. If something breaks, you won't know which change caused it.
Do Core Web Vitals Actually Affect Rankings?
Yes, but with nuance.
Core Web Vitals are a ranking factor, but they're a tiebreaker, not a trump card. A page with great content and poor CWV will still outrank a page with poor content and great CWV.
What the Data Shows
- Sites passing CWV rank 28% higher on average
- 56.3% of websites now meet all CWV thresholds, up from 40% in 2022
- 88% of web performance experts believe CWV will become more critical in rankings by 2025
When CWV Matters Most
If you've noticed a sudden drop in Google rankings, poor Core Web Vitals could be a contributing factor, especially if the drop coincided with a Google update or a site change that affected performance.
CWV has the biggest ranking impact when:
- You're competing for position 1-3: Among similar-quality pages, CWV can be the deciding factor
- You're in a competitive niche: Where content quality is broadly similar
- Google shows SERP features: Fast pages are more likely to appear in Top Stories, carousels, etc.
CWV matters less when:
- Content quality differs significantly: A comprehensive guide beats a thin page regardless of speed
- You're targeting low-competition keywords: Other factors dominate
- You're building topical authority: Content depth and backlinks matter more initially
The Real Business Case
Forget rankings for a moment. Core Web Vitals improvements directly impact user behavior:
| Improvement | Business Impact |
|---|---|
| LCP from 4s to 2.5s | 15% higher conversion rate |
| Passing all CWV | 50% better visitor retention |
| Mobile CWV optimization | Reduced bounce rate on mobile (where 75% of sites fail) |
A non-profit improved their CWV and saw traffic increase from 645,000 to 820,000 users within six months. Was that purely SEO? Probably not. Better performance also meant users stayed longer, shared more, and returned more often.
Fix CWV because it makes your site better, not just because Google told you to. Combine CWV improvements with strategies to boost your organic CTR for maximum impact on traffic.
Frequently Asked Questions
How do I check Core Web Vitals for my site?
Use PageSpeed Insights for individual URLs or Google Search Console's Core Web Vitals report for site-wide data. PageSpeed shows both field data (real users) and lab data (simulated). Focus on field data for SEO since that's what Google uses for rankings.
Do Core Web Vitals affect SEO rankings?
Yes. Sites passing Core Web Vitals rank approximately 28% higher than failing sites. However, CWV is one of many ranking factors. Content quality, backlinks, and relevance still matter more. Think of CWV as a tiebreaker among otherwise similar pages.
What replaced First Input Delay (FID)?
Interaction to Next Paint (INP) replaced FID as a Core Web Vital on March 12, 2024. INP is more comprehensive because it measures all interactions throughout a page's lifetime, not just the first one. Many sites that passed FID now fail INP.
Why is my mobile Core Web Vitals score lower than desktop?
Mobile devices have slower processors, less memory, and often slower network connections. The same page that loads in 1 second on desktop might take 3 seconds on mobile. Google uses mobile-first indexing, so mobile scores are what matter for rankings. Optimize for mobile first.
How long does it take for Core Web Vitals improvements to affect rankings?
Field data in the Chrome User Experience Report (CrUX) updates on a rolling 28-day basis. After implementing fixes, allow 4-6 weeks to see the full impact in both your CWV metrics and rankings. Lab data (Lighthouse) updates immediately and is useful for verifying fixes work before waiting for field data.
What's a good LCP score?
Google considers LCP "good" at 2.5 seconds or less, "needs improvement" between 2.5-4 seconds, and "poor" above 4 seconds. Aim for under 2.5 seconds on mobile for best results. Top-performing sites achieve LCP under 1.5 seconds.
Stop Guessing. Start Measuring.
Core Web Vitals aren't mysterious. They're specific metrics with specific thresholds and specific fixes.
Your action plan:
- Check your current scores in PageSpeed Insights and Search Console
- Identify failing metrics and which pages are affected
- Fix the biggest issues first: Usually images without dimensions, render-blocking resources, or slow server response
- Verify improvements in both lab and field data
- Monitor ongoing since new features and content can introduce new problems
The sites that win in 2026 aren't just the ones with the best content. They're the ones that deliver great content fast. Every second of delay is users lost, conversions missed, and rankings surrendered to competitors who got this right.
You have the metrics. You have the fixes. What you do next is up to you.
Fast sites win. Slow sites lose. It's that simple.